
As a consultant I often debug on NetScaler related issues. When I do this debugging I use different methods like nstcpdump, nstrace.
Nstcpdump I normally use just to clarify where we are sending data and if we are getting any response – this can tell if there are routing or Firewall issues.
SNIP = 10.11.12.152, Web Server = 192.168.1.152 port 8443
Routing problem, only sending data no answers:
![]()
Firewall Block, only sending data no answers:
![]()
And when it works we see monitoring data every 5 sec. (default):
![]()
As you see we can not tell from the nstcpdump if it is a routing problem or a Firewall block. We can only see that we are sending monitor data but never get any answer back.
The above is just for quick debugging on network related issues. When we want to do some deeper debugging nstrace is the tool to use.
As I do this it is important to inform the customer that we can see everything, and I mean EVERYTHING. I think this is important because we can see data that was not intended for us to see.
Let me show you.
I just do a simple nstrace with this command:
start nstrace -size 0
and stop it again with this command:
stop nstrace
The trace file will be in the /var/nstrace catalog on the NetScaler. Opening the trace that I just made looks like this (filtered with “frame contains “nsroot””:
![]()
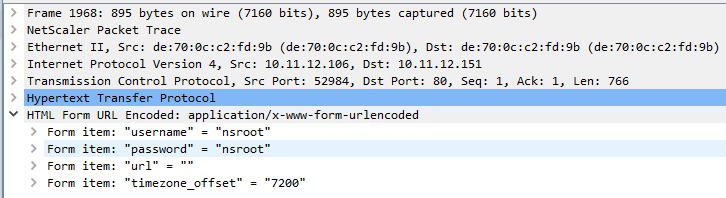
As the trace show I just did a logon to my NetScaler while the trace was running, and I can se what username and password was provided. No surprise, I use the default nsroot, nsroot for my test NetScaler which is not in production.
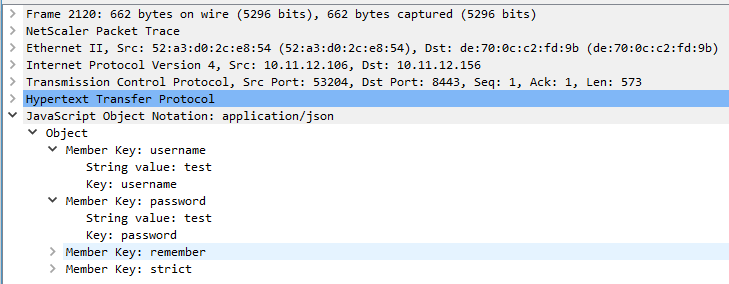
But what if a user at the same time did a logon to the VIP = 10.11.12.156 for the Web Server 192.168.1.152?
Yes, I can see that too:
![]()
But what if we are using SSL connections? Well that is not a problem as we can get the NetScaler to decrypt the trace by doing this command (Not on SSL_BRIGDE sessions):
start nstrace -size 0 -mode SSLPLAIN
With that the login for an SSL session will be in clear text within the trace. I have not made screenshots of that as It will look just like the above screenshots.
But what do we then do to keep our back safe. Well we can do some filters on the traces, so we only see the traffic we are interested in.
Here are some examples.
To see traffic to and from a specified host:
start nstrace -size 0 -filter CONNECTION.DSTIP.EQ(192.168.1.152).OR(CONNECTION.SRCIP.EQ(192.168.1.152))
To see traffic for a specified port:
start nstrace -size 0 -filter CONNECTION.PORT.EQ(514)
By using filters on that nstrace command we only get the traffic we need for debugging on a specified system.
And again, remember to get permission to do the trace and tell the customer that when we do this we can see all traffic to and from a system.
Conclusion:
Well, this is only best practice for us NetScaler consultanst. We need to inform the owner of the system that when we do debugging on their system, we can get data that was not intended for us to see. Always keep a good and open dialog with the system owners so that we don’t get into trouble.